


Internally Insulated Solid Walls
The SPAB Building Performance Survey
Caroline Rye and Cameron Scott
 |
|
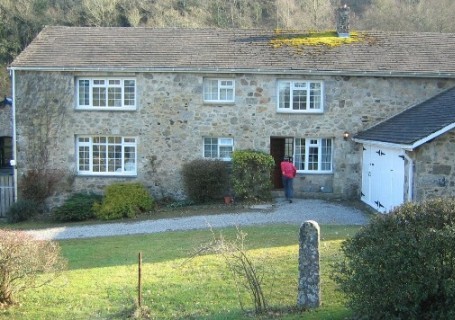
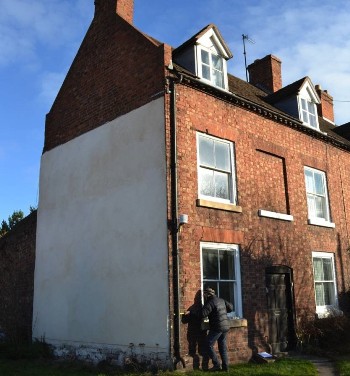
| North-west facing granite wall in Drewsteignton, Devon: one of two internally insulated solid walls featured in the Building Performance Survey, this 600mm granite wall had been internally insulated with 100mm of polyisocyanurate board with an air gap and a plasterboard and gypsum skim finish. |
The Society for the Protection of Ancient Buildings Building Performance Survey (SPAB BPS) was first established in 2011 to address the dearth of information on energy efficiency and traditional buildings. In particular, there was an absence of measured evidence showing how traditional buildings performed before alteration, and a lack of understanding as to what constituted effective and risk-free energy saving interventions.
Of specific concern was the potential for damage to fabric and occupants’ well-being over the long-term as a result of the application of insulation and reductions in ventilation/ air infiltration in older buildings.
The BPS measured various aspects of performance in solid-wall, traditionally constructed properties before and after energy efficiency retrofitting. The survey looked at fabric heat loss, air leakage, indoor air quality, wall moisture behaviour, room comfort and fabric risk conditions in seven houses.
A central part of the study looked at the impact of insulation on solid walls. Measurements of four of the buildings were made again after refurbishment, and the analyses of three are ongoing, with findings published annually on the SPAB's website.
One wall in each of the three buildings chosen – two internally insulated and one an externally insulated cob wall – were subject to extended interstitial hygrothermal monitoring. In particular, the internal insulation of a wall is seen as a risk because fabric on the external side of the wall, outside the insulating layer, no longer benefits from the heat inside the building and in the winter months becomes cooler. The effect of this is to lower the dew point, meaning the air within the wall may more frequently reach saturation – 100% relative humidity (RH) – leading to condensation.
High levels of fabric moisture could give rise to uncomfortable living conditions and increased heat loss. They could also have serious consequences in the form of mould growth and rot, which can be harmful both to human health and to the structural integrity of the building.
Annual Average Sat Margins |
Sensor 1 |
Sensor 2 |
Sensor 3 |
Sensor 4 |
|
SHREWSBURY |
|||||
2011 |
6.46°C |
6.41°C |
5.12°C |
3.96°C |
|
2012-13 |
6.34°C |
5.08°C |
4.30°C |
3.08°C |
|
2013-14 |
6.33°C |
5.00°C |
4.08°C |
3.45°C |
|
2014-15 |
6.85°C |
5.16°C |
4.20°C |
4.24°C |
|
DREWSTEIGNTON |
|||||
2011 |
5.30°C |
4.82°C |
3.53°C |
2.38°C |
|
2012-13 |
5.60°C |
2.23°C |
1.53°C |
0.57°C |
|
2013-14 |
6.90°C |
1.97°C |
1.14°C |
0.49°C |
|
2014-15 |
7.09°C |
1.58°C |
0.67°C |
0.59°C |
|
| Table 1 Annual average saturation margins for interstitial sensors 2011-2015. Orange shading indicates increased margins, blue indicates decreased margins | |||||
Over the past four years, as part of the BPS, moisture profiles (in the form of vapour, measured as RH) and temperature profiles have been monitored continuously at four points through and either side of insulated solid walls. (This element of the BPS work was extended in 2014 due to a grant provided by English Heritage.)
This method of moisture monitoring, which relies on high quality instrumentation and careful installation, has been developed specifically for this purpose. The measurement of water vapour in air is used to provide an indication of the moisture performance of the wall.
The use of air as a proxy medium for moisture measurements has a number of advantages. As a quantity it provides an indication of dew point conditions within the wall (100% RH) and %RH is commonly used within fabric risk indices, 80 per cent being the threshold value often quoted for the formation of mould growth (see Further Information: DCLG and Altamirano-Medina).
Unlike measurements of moisture made via electrical resistivity, it is unaffected by salt contamination and does not rely on assumptions regarding resistivity and moisture content, which is material-dependent and can therefore be hugely variable.
In order to identify the fundamental drivers of hygrothermal performance within the walls, as opposed to just seasonal differences when the walls may become wet as a result of local weather conditions, long-term monitoring of fabric is necessary. By 2015 it was felt that sufficient evidence had been gathered to be able to describe, with some certainty, the reasons for the different performance of the walls in the BPS.
Of the two internally insulated solid walls featured in this study, the first was a 345mm brick wall at Shrewsbury which was insulated with 40mm of woodfibre board and finished with 20mm of lime plaster. This wall does not incorporate any formal vapour control layer (VCL). The addition of a VCL is standard practice when adding internal insulation to solid walls to limit the movement of internal room vapour into the wall where cold fabric beyond the insulation might cause vapour to condense, but the practice has been called into question by conservation specialists where traditional solid walls are concerned.
The other example chosen for the study was a 600mm granite wall at Drewsteignton in Devon. This wall had been internally insulated with 100mm of polyisocyanurate (PIR) board and, following manufacturers guidelines, an air gap, plasterboard and gypsum skim finish. In this construction the insulation is bound front and back with a metallised foil sheet which, being impermeable, performs the function of a VCL.
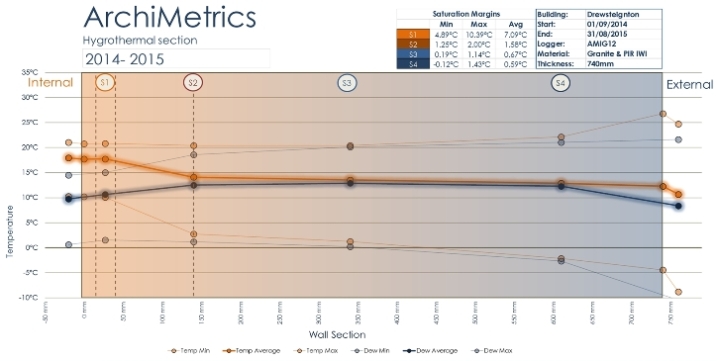
Findings from the interstitial hygrothermal monitoring are examined across a number of bases. Vapour behaviour is examined as both relative and absolute humidity as well as in the form of dew point gradients which extend through the wall section. Dew point gradients are compared against the actual temperature gradients measured through the wall, the difference between the two being the drop in temperature required to create saturation conditions. This difference, which is described as the ‘saturation margin’ and is measured in °C, provides another indicator of risk for the wall in terms of how close the air is to saturation, for what duration and at which times of year.
 |
 |
||||
| Figure 1 Wall sections showing build-ups and locations of sensors for walls at Shrewsbury and Drewsteignton | Monitoring equipment on the internally insulated granite wall at Drewsteignton | ||||
In 2012, following insulation, the saturation margins measured in both walls narrowed, something that might be expected for internally insulated walls as temperatures reduce on the cold side of the insulation. However, it is long-term trends that are most of interest and here we see a difference between the walls.
Saturation margins continue to narrow year on year in the granite wall at Drewsteignton, indicating a wall moving closer to permanent saturation of the air within parts of its structure. The other internally insulated wall, at Shrewsbury, appears more stable with wider margins and little year on year change in these following insulation.
Another way to examine moisture behaviour in the walls is to study their RH profiles. In particular, RH behaviour in the central part of the walls, at sensors 2 and 3, is indicative of its underlying performance because this part of the wall is less influenced by both the wetting and drying influences of external and internal environments.
In Figure 3 it can be seen that since 2012 measurements of RH at sensors 2 and 3 within the wall at Drewsteignton rise immediately following the application of insulation and continue to rise over three years of measurements. There are periods of rising RH seen in the traces from sensors in the Shrewsbury wall but these are also seen to fall at certain times of the year indicating periods when the air in the wall is able to dry via evaporation. Importantly, at Shrewsbury, there are also times when RH quantities fall below those initially measured immediately after the wall was insulated, something not seen at Drewsteignton.
In terms of risk, the quantities of RH measured at Drewsteignton exceed 80% from March 2012 onwards and would suggest that the wall, or perhaps more accurately certain materials such as timbers which are embedded in the wall, may be at risk of mould growth. The majority of the measurements for the wall at Shrewsbury fall below 80%.
 |
|
| Figure 2 Hygrothermal section showing temperature and dew point gradients for the wall at Drewsteignton |
The reasons for the differences in moisture behaviour between the two walls originate in their very different constructions. It is possible, however, to extrapolate from this certain qualities that determine moisture behaviour and apply this learning to solid walls more generally.
The wall at Shrewsbury is south-facing and, compared to that at Drewsteignton, quite thin. The pointing is in poor condition and the brick is quite porous and permeable. It has also been insulated with a relatively small quantity of a vapour-open, capillary-active and hygroscopic material with no formal VCL. Of the walls under study, it is the driest in terms of both relative and absolute humidity (%RH and AH g/m3) and it has the widest saturation margins. Vapour responses in this wall are very dynamic and at times quite extreme. This is due to the nature and orientation of the construction. The external side of the wall quickly becomes wet during periods of driving rain and this moisture can easily penetrate towards the centre of the wall. However, the wall also dries out rapidly due to heat from direct (and diffuse) solar radiation and plentiful air exchange through the substrate.
It is noticeable that, despite this volatility, overall the wall operates below the 80% RH threshold for mould growth. It is also possible that the quantity of insulation installed (40mm), which reduced the measured in situ U-value from 1.48 W/m2K to 0.48 W/m2K, ensures that while the passage of heat through the wall is reduced, sufficient heat still travels from interior to exterior during colder winter periods to provide a safe margin between the measured air temperature and the dew point temperature. It is important to note that these U-values have been measured rather than derived from the standard calculating method, which has been shown to have limitations when used to estimate heat loss for solid walls (see Further Information: Baker and BRE).
 |
||
| Figure 3 RH trends for the walls at Drewsteignton (solid) and Shrewsbury (dotted), 2011-2015 | ||
The wall at Drewsteignton is quite different, being a north-west-facing, 600mm thick granite construction. In this wall we find higher moisture levels (in terms of both %RH and AH g/m3) and narrower saturation margins. We also find, over the past three years, a trend of rising RH in the centre of the wall which, year on year, moves this part of the wall closer to saturation conditions.
As this trend has continued over a number of years, we conclude that the high RH within the wall is not solely a response to atmospheric conditions but is also a function of certain qualities of the construction that might limit or inhibit drying.
This may be, in part, down to the heavyweight nature of the wall and its aspect, but vapour profiles have climbed since the wall was insulated and have not returned to pre-insulation levels. This suggests that the insulation itself may be having some impact on the wall’s performance, although it is not clear whether this is primarily due to its thickness or its impermeability.
The wall at Drewsteignton has been insulated with a greater quantity of more thermally resistive insulation and this reduced the measured in situ U-value from 1.20 W/m2K to 0.16 W/m2K. This ensures that less heat passes into the cold side of the masonry during the winter period, thus saturation margins are lower and air is more likely to become saturated and remain saturated for longer periods, limiting the wall’s ability to dry. Furthermore, the foil-facing of the PIR board acts as a barrier to the movement of moisture from the core of the wall, which can no longer access the potential evaporative surface of the interior wall face.
In conclusion, we find that the performance of these walls is in part conditioned by their individual material components, including changes made to the fabric to improve energy efficiency. Interstitial condensation has been a particular concern, yet the internally insulated brick wall at Shrewsbury, which uses a limited quantity of insulation and does not incorporate a VCL, has stable vapour responses that operate within safe limits. In contrast, at Drewsteignton, where insulation has reduced the U-value of the wall to a fraction of its previous heat loss and a VCL limits the movement of vapour towards the internal side of the wall, vapour conditions are deteriorating.
The measurements from the BPS tell us that, rather than internally generated moisture, the influence of the external environment in combination with the individual circumstances of the walls – their materials, aspect and condition – has the greatest impact on their moisture performance. These walls are solid, there is no capillary break in the form of a cavity or damp-proof course to prevent moisture, particularly wind-driven rain, penetrating deep into the core of the wall.
 |
|
| Monitoring a south-facing brick wall at Shrewsbury |
Many solid walls are thick, built with heavyweight materials and they can be shaded and/or sheltered. This means that the ability of heat and air movement to dry these walls may be limited. While this may not, prior to insulation, create a moisture problem in the wall, the method by which a wall is retrofitted must take into account all the factors which might impinge upon its performance.
The decision as to what type and what thickness of wall insulation might be suitable for a solid wall cannot be answered by looking at heat loss reduction alone. Those charged with improving the energy profiles of these buildings must view the building as a whole, looking at how it may perform in its specific context including individual wall aspects and what the effect of its constituent materials, condition and finishes may be.
The wall at Drewsteignton shows that the use of a relatively large quantity of higher performing close-cell insulation, incorporating an impermeable VCL, can result in a risky vapour profile. This is not to say that the application of similar material to the internal wall at Shrewsbury would have produced the same results. Indeed, at this location the wall’s performance may have been more satisfactory as this wall is able to dry more readily.
However, the BPS shows how complex and multifactorial the hygrothermal performance of walls can be. It is an interplay between materials, condition and context, and the exact effect of all these upon the long-term performance of the building may remain unknown or difficult to predict.
Given this uncertainty, we need to acknowledge the limits of our understanding and adopt a precautionary principle. This would ensure that elements are not deprived of all internally generated heat by excessive amounts of internal insulation because it may be that it is the contribution of this heat, in combination with external solar radiation, that allows the wall to moderate its moisture load over time.
In addition, materials that are vapour-open and capillary-active and thus have some ability to move moisture through the structure to surfaces from which it can evaporate are also more likely to be a safer option for the insulation of a solid wall.
This study demonstrates that it is possible to make positive changes to the energy efficiency of solid walls through the application of insulation but that an approach that favours limited improvements to heat loss and materials that promote moisture movement may introduce less risk than alternative strategies.
~~~
Further Information
H Altamirano-Medina et al, ‘Guidelines to Avoid Mould Growth in Buildings’, Advances in Building Energy Research, Vol 3:1, 2009
P Baker, Technical Paper 10: U-values and Traditional Buildings, Historic Scotland, Edinburgh, 2011
Building Research Establishment, In-situ Measurements of Wall U-values in English Housing, BRE/Department for Energy and Climate Change, Watford, 2014
Department for Communities and Local Government, Approved document F: Ventilation, NBS, London, 2010