


The Archaeological Investigation and Digital Documentation of Historic Buildings
Tom Addyman
 |
|
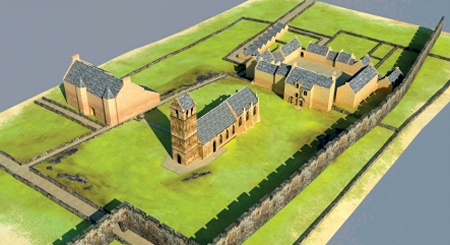
| Figure 1 The site of Edinburgh University’s Old College in pre-Reformation times (c1530): the modelling is based on excavations, early drawings and map evidence (Both images: Luma3D Interactive/Addyman Archaeology/ University of Edinburgh) |
The planning process now routinely imposes archaeological conditions on work to historic structures, including recording, investigation, analysis and monitoring during works.
Major custodians of historic buildings and sites, particularly the national statutory bodies responsible for monuments in care, now regard proper survey, recording and analysis as a necessary aspect of responsible management and an integral part of informed conservation.
Archaeologists have long been involved in the analysis and recording of architecture. In recent decades, and in the past decade in particular, the field has developed dramatically due to a digital survey revolution.
Today, those involved in curating and repairing historic buildings and sites and those responsible for the commissioning of survey work are presented with a broad array of techniques and options which support the recording process.
Increasingly it is the archaeologist’s role to manage the process of digital survey, to oversee survey specifications and to ensure that data capture and modelling are properly planned and implemented. This role requires archaeologists to precisely identify the desired outputs, determine resolutions and carefully consider the final desired result in relation to the client’s needs.
In the process of commissioning survey work it is often the buildings archaeologist’s own requirements within the existing guidance that are the most stringent. Beyond obtaining the dimensionally correct data that is needed to generate the 2D and 3D line imagery desired by the architectural practice, the archaeological record will commonly require exhaustive detail of a site. This takes the form of high resolution imagery that allows the complexities, structural nuances, minor alignments, textures and colours of the subject structure to be examined in detail and then retained as a permanent primary archive.
3D DATA AND THE ROLE OF THE SURVEYOR
For decades the surveyor captured 3D data but supplied 2D information in the form of topographic survey drawings, building plans, elevations and sections. In most cases the third dimension was represented by annotations or contour lines. The relationship between the surveyor and the client was, in the main, well understood. The client defined the end-product and the surveyor used the appropriate technology and methodology to satisfy client needs cost-effectively within the remit.
Now, however, with the increasing demand for high resolution imagery, virtual or augmented reality, the development of 3D city models and, perhaps most importantly, the mandating of Building Information Modelling (BIM) by the UK government, 3D data is becoming an essential deliverable within the process.
 |
|
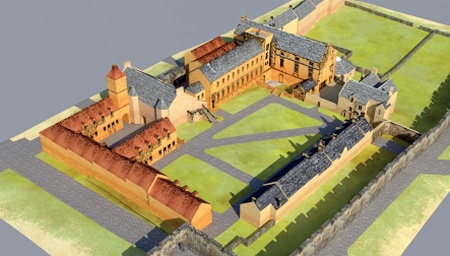
| Figure 2 The same perspective of the site showing the Old College as it had developed by the later 18th century: note that in this case the evidence of historic drawn views has been applied directly to the model surface |
Clients are struggling to specify clearly their 3D data needs and the supplier/client relationship is faltering. Sometimes the client strays into the supplier’s territory by specifying the technology (‘I want a laser scan’) rather than defining the product (‘I need a 3D wire-frame model to this specification’). And as an industry we are sometimes guilty of promoting the technology rather than the solution.
However, clients in the heritage sector are almost unanimously enthusiastic about the potential of 3D information, particularly because of its ability to communicate complex information to the public.
Heritage sector clients can be demanding, keen to have a comprehensive record of their site and wanting 3D digital models for visualisation, digital reconstruction and augmented reality. Budgets, however, are usually very limited and it is the task of the specialist survey supplier to attempt to meet their aspirations at a cost that is affordable and, in some cases, to provide early advice on the practicalities and implications of various methodologies.
Often, for the comprehensive documentation of a heritage site, other field datasets are obtained and this can include archaeological excavation information in addition to geophysical, ecological and condition surveys. Historical evidence may be available in a wide variety of forms including maps, plans, documents, reports, photographs, etchings and paintings, and these are valuable where digital reconstruction is wanted – for example, to display a particular period in a site’s history (Figures 1 and 2).
3D DATA CAPTURE TECHNOLOGIES
Today specialist surveyors can use a number of measurement technologies to create survey imagery and 3D datasets to meet clients’ needs. Each has particular applications and each has its advantages and disadvantages (in addition to cost implications).
Laser scanning
Laser scanning captures a large amount of 3D data, generating the now familiar ‘point cloud’ where each point has a distinct Cartesian location, light intensity and colour. Scanning can be done in poor light and even at night. Data can be captured rapidly but the instruments are relatively expensive. Another disadvantage is that laser scanners can have difficulty in obtaining data at height. Most laser scanners require a stable platform during scanning and using hoists and scissor lifts can prove troublesome. For these reasons it rarely provides a complete point cloud over a complex heritage site and even with careful planning, data voids can be significant.
In the heritage sector the point cloud is rarely the final deliverable and laser scanning may be an expensive solution depending on the client’s actual needs.
Photogrammetry and Structure from Motion
Although it has a long history, photogrammetry remains a powerful means of obtaining point cloud data. Stereo photographs are taken with precise measurements and calibrated to allow accurate orthographic imaging. More recent Structure from Motion (SfM) techniques follow the same principle but use a large number of images from fixed-wing aircraft or unmanned aerial vehicles (UAVs) and/or taken from cameras on the ground, on platforms, or mounted on poles that allow comprehensive coverage of a site. The images are processed to create a 3D point cloud, mesh and textured mesh at a resolution to suit the final output or use.
 |
 |
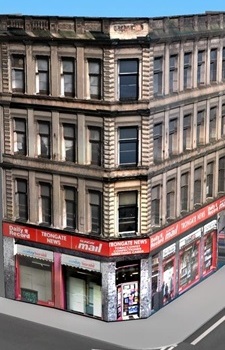 |
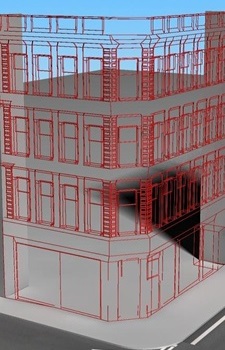
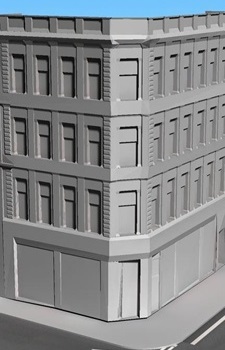
| Figure 3 A 3D textured model created from total station survey measurements | ||
Instrument survey
Traditional land survey techniques using total stations and GPS equipment are often used to provide the control framework for the laser scan and photogrammetric data capture processes and to supplement the point cloud information captured by other methods.
Only the points selected in the field to create the final output are measured. Figure 3 shows the vectors captured by a reflectorless total station to define a building facade. Subsequent modelling and photographic texture were added to the model to create the end-product. For a client viewing the end-product, it would be difficult to determine the mix of methodologies used, but each provides distinct types of data which can be extracted and used for a variety of functions.
Traditional measured survey
In spite of the advanced survey technologies available, there are many situations where a very low-tech approach is equally effective for the survey of historic buildings and may be more appropriate and cost-effective. This is particularly true for smaller, more complex or irregular structures, for the recording of individual architectural details or for sites where survey needs to take place in stages – before and then during a programme of building works.
It is a distinct advantage that survey is carried out in detail by those who are also responsible for assessing and understanding the building, so analysis can be made and developed as the survey proceeds in a continuous and seamless process. Thus the ability to carry out accurate hand measurement and good drafting skills developed over many years are essential tools for many buildings archaeologists.
Hand survey can involve a spectrum of activities – sketched individual details, measured sketches, hand-measurement of features which are then drawn directly onto metric paper, the marking-up of existing drawings or imagery, and so on. And most commissioned survey work on historic buildings, whether digital or by hand, still involves a significant component of close secondary scrutiny on site by the archaeologist during which survey imagery is subject to correction and refinement, and the layering on of detailed analytical and interpretive information. There is little substitute for direct one-to-one contact between archaeological surveyors and their subjects.
Today the outputs of such drawn surveys are usually converted into digital imagery in the office and can then be merged with most other digital graphics media.
ANALYSIS AND UNDERSTANDING
None of these data capture techniques in themselves generate the final output or analytical record of a building. The imagery requires processing, presentation to the required standard and the addition of further layers of interpretive information. High quality survey data can obviously support and speed up this process but it is only ever the base for a full analytical visual inspection and detailed record.
An archaeological analysis of a historic building typically gathers a great deal of additional qualitative information, usually through a process of careful visual inspection of the subject.
It is routine for this information to be superimposed on the graphic imagery as additional layers or linked information (Figure 6). This includes constructional information, material types, information relating to phasing and function, catalogue references for information on specific features, mapping of mortar types, petrological assessment and so on. There are also inputs from other specialists such as moisture mapping, rot surveys, the plotting of structural failure and paint analysis data.
SPECIFICATION
Survey work should be properly planned from the outset and the required outputs clearly understood and defined. Specification for archaeological survey should involve the client body and/or the statutory body requiring the survey, the archaeological advisor and the survey specialist. The latter should be competent to advise on the relative suitability of a range of survey techniques and methodologies based on the client’s needs and the most appropriate approach to a given structure.
Ideally the statutory body should be able to advise on standards for the work, the nature of the outputs, the conventions for the presentation of the survey and recording data, and procedures for suitable archiving.
ADVANTAGES AND LIMITATIONS
Technology plays an increasingly important role in informing conservation work, providing the tools with which data can be gathered to support analysis and understanding. Large amounts of visual information can now be gathered in minutes. This can be of particular significance where speed is a factor (in advance of irreversible change through planned alteration, controlled demolition or, as in the case of recent events in Syria and Iraq, wilful destruction).
 |
|
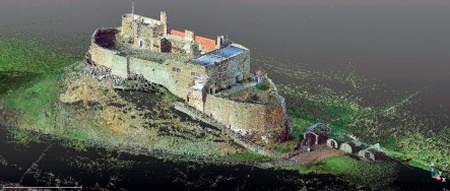
| Figure 4 Lindisfarne Castle: a point cloud generated from terrestrial laser-scanned data | |
 |
|
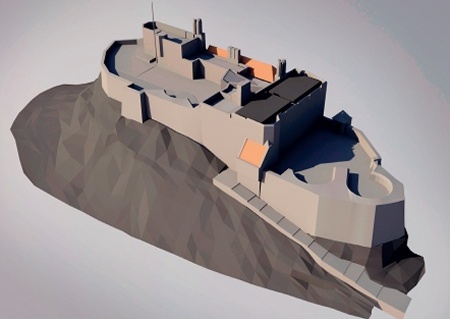
| Figure 5 General modelled framework of the castle |
Digital survey and recording can also be beneficial where inaccessibility is a factor, for example where the building is fire-damaged or otherwise unsafe, where the building is physically difficult to access, such as a cliff-top ruin, or where the expense of scaffolding is prohibitive.
It can also be particularly advantageous where scale is a factor, allowing imagery of large areas of substantial structures to be captured at high resolution very cost-effectively.
As outlined, high-resolution 3D survey imagery can be modelled to great effect. For the archaeologist this allows exciting new possibilities for the analysis of historic buildings. In the case of complex historic structures, nuances and irregularities can be highly meaningful and digital imagery can be manipulated in various ways to enhance understanding of them.
Conversion from colour to a grey-scale image can dramatically increase visual clarity; light can be cast across the surface from any angle to tease out constructional subtleties, tooling details, marks and so on. The digital image can be distorted in any dimension to bring out detail that is invisible to the naked eye. Manipulation of the colour scale can improve contrast and dramatically enhance the level of visible detail.
THE END-PRODUCT
The process of initiating a building survey, although dependent on many factors, should be based on a workflow process that takes into consideration a number of factors, and will often contain a range of techniques that can be used to achieve the final product.
With the increasing variety and sophistication of techniques available to the surveyor, the archaeological recording of important historic buildings and sites increasingly requires close co-operation between the survey supplier and the archaeologist to service the client’s requirements and to most effectively (and most cost-effectively) achieve the desired results. Such survey techniques are the tools by which complex, extensive or inaccessible sites can be rapidly and inexpensively surveyed.
The quality of the end-product is determined by a combination of the quality of the input data and the ability to manipulate that data in terms of presentation and understanding of the subject. Advanced survey techniques are not a substitute for the understanding that comes from long experience, rather they complement it.
As the demand for 3D data rapidly increases, the surveyor must use existing and emerging technologies to provide 3D data cost-effectively. A colourised, comprehensive point cloud is an essential component of the dataset which records a site but it should only rarely be the actual deliverable. Most clients are not yet clear or comfortable in specifying their 3D requirements – the surveyor and archaeologist have a key contribution to make in defining a product-based specification for these data and this will need to be tailored to the building, its complexity and details, as well as the desired outputs.
CASE STUDY: LINDISFARNE CASTLE
Recent survey work for the National Trust (NT) at Lindisfarne Castle, which is located in an exposed position on the rugged Northumberland coast, proved a challenging subject that required many of the techniques described above.
The survey methodology was developed by archaeologists in liaison with the NT, the project architects, with survey providers and a specialist in digitally modelled imagery. The survey and recording elements that related to the proposed works were developed in an integrated project design, or ‘written scheme of investigation’, developed to respond to a broad range of perceived requirements for survey and archaeological recording at the site in advance of a major programme of repair works.
The survey and recording processes were necessarily closely interlinked, combining the recording and analysis that will inform the proposed works and, once the works are under way, the recording of any new areas of fabric which are revealed. Thus survey and recording was planned as an integrated and incremental process which, after much consideration, was felt to represent the most effective use of resources. In summary, the objectives of the exercise were to:
- capture comprehensive survey imagery of the castle internally and externally, and (at little additional expenditure) the wider site
- provide corrected base-level survey data for the castle and site in digital format
- digitally model the superstructure of the castle internally and externally.
Once the digital modelling phase was complete, the digital model would be used to:
- carry out a comprehensive moisture mapping exercise relating interior and exterior thermal imagery
- act as a framework for representing/ overlaying the evidence from both past and current analytical recording exercises
- permit the mapping of the history of secondary (post-Lutyens) repairs
- form a resource base for other purposes such as future recording or archaeological works, and act as a basis for the cumulative and/or more general mapping of the evolutionary history of the castle
- provide information for interpretative representation
- form the basis of a building information model as a management tool for the proposed works and for the future management of the site.
 |
|
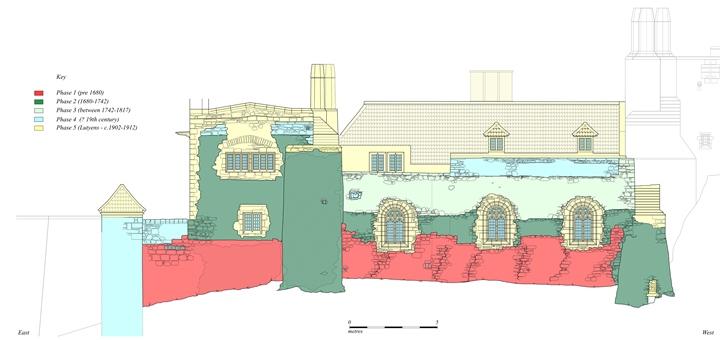
| Figure 6 The north elevation of Lindisfarne Castle: hand-recorded imagery from a survey in 1996 was digitised and merged with the digital survey carried out in 2015 to show analytical information and phases of construction and repair. |
The challenges of the site
The principal challenge for any works at the castle is the inaccessibility of much of its precipitous crag-top location. This had hitherto precluded comprehensive survey – accurate architectural survey during major works in the mid-1990s had only extended to the accessible areas of the superstructure. The present project required all-embracing survey coverage, which also necessitated accurate modelling of the partly vegetation-obscured rock-faces below the castle’s walls in advance of stabilisation. Another difficulty for more conventional survey was the extreme irregularity of the structure overall, its labyrinthine passages and its curious internal geometry.
Data capture
The new survey involved data capture by means of laser-scanning and high-resolution digital photography, the latter taken both manually and by means of a UAV (Figure 4). Each technique was applied as appropriate so that comprehensive coverage was achieved of all areas. The efficiency of the exterior coverage by the UAV also permitted entire coverage of the topography of the field and foreshore areas surrounding the site, data which will be retained for ongoing management of the site.
Creating the modelled imagery
The captured image data was registered and combined to create a single model (Figure 5). Point-cloud imagery was overlain with the photographic to produce high-resolution orthographic projections. These were then digitised by hand to overlay a stone-by-stone level of detail and further corrected by hand on site.
Applications
Having achieved this level of dimensionally accurate base survey detail, the imagery was then used as a basis for layering-on various categories of qualitative information: architectural data, condition-related information, archaeological recording and analytical observations.
The archaeological data from recording works carried out by the author on the north elevation during works in 1996 was digitised and integrated onto the model as an analytical layer. Analytical mapping included the plotting of areas of repairs subsequent to the early 20th century works of Sir Edwin Lutyens, much of which involved the use of inappropriate materials, particularly cement and (internally) various proprietary products.
Thermal imagery is to be overlain on the model both externally and internally to attempt to map the routes of moisture ingress into the superstructure. Drainage and water run-off systems will be similarly plotted and modelled in order to better understand the complexities of the site.
The resulting model will also be a powerful interpretative tool on which will be plotted the analytical history of the castle, its phases and evolution. When this information is cross-correlated with the detailed historical records for the site it will be possible to model the structure at fixed points in its evolution over its 500-year existence. This information will be made accessible to the visiting public on site as the work progresses, and will also be accessible as a web-based resource.
~~~
Acknowledgements
The author would like to thank John and David McCreadie, and David Connolly of CHC Heritage for their assistance in the preparation of this article, and the National Trust (North Region) for permission to use material relating to Lindisfarne Castle.
Further Information
Chartered Institute for Archaeologists
Historic England, ‘Surveying and Recording Heritage’, 2015